Querying IBD data
Find all Python code used on this page here: ibd_data.py
Now that we have uploaded all our data to a Neo4j database, it becomes rather straightforward to identify taxa with the most associations to certain metabolites or specific classes of chemicals. Keep in mind that only the metadata for metabolite clusters in our correlation file were uploaded; therefore, some clusters and their related metadata are not currently included. Regardless, we can take a closer look at some metabolites that Franzosa et al. (2019) found in their study. Specifically, they found that bile acids and sphingolipids were enriched in patients with IBD. In our Neo4j database, all metabolite clusters that contain bile acids should be connected to the Chemical_class node with the name Bile acids, alcohols and derivatives, while clusters that contain sphingolipids should be connected to the Chemical_class node with the name Sphingolipids.
For convenience, we will run our queries from a mako driver, but you can also run them directly from the Neo4j Browser to visualize them. The script below sets up a mako driver. For instructions on starting a Python interpreter so you can call the driver, please see the API section of the manual.
import os
import pandas as pd
from mako.scripts.io import IoDriver

loc = os.getcwd()

driver = IoDriver(uri='neo4j://localhost:7688',
                    user='neo4j',
                    password='test',
                    filepath=loc,
                    encrypted=False)
First, let us take a look at the number of species that have associations to both of these classes of metabolites. We can do this by specifiying a pattern connecting a taxon to a metabolite, and that metabolite to a named chemical class.
query = 'MATCH p=(:Taxon)--(:Metabolite)--(:Chemical_class {name: "Sphingolipids"}) RETURN p'
results = driver.query(query)
print(len(results))

30

query = 'MATCH p=(:Taxon)--(:Metabolite)--(:Chemical_class {name: "Bile acids, alcohols and derivatives"}) RETURN p'
results = driver.query(query)
print(len(results))

78
It looks like the correlations indeed included some that have previously been linked to IBD. But which taxonomic families are most responsible for these correlations? We can request the taxonomic information simply by extending the query.
query = 'MATCH p=(:Family)--(:Taxon)--(:Metabolite)--(:Chemical_class {name: "Sphingolipids"}) RETURN p'
results = driver.query(query)

query = 'MATCH p=(:Family)--(:Taxon)--(:Metabolite)--(:Chemical_class {name: "Bile acids, alcohols and derivatives"}) RETURN p'
results = driver.query(query)
We can make a quick barplot in Python to take a closer look at the family assignments. The script below first extracts a list of Family assignments from the query output and then visualizes this. The family name is the first node returned by this pattern, so we use a list comprehension to get to these names.
import matplotlib.pyplot as plt
from collections import Counter

query = 'MATCH p=(:Family)--(:Taxon)--(:Metabolite)--(:Chemical_class {name: "Sphingolipids"}) RETURN p'
results = driver.query(query)
family_names = [x['p'][0]['name'] for x in results]
counts = Counter(family_names)

labels = counts.keys()
vals = counts.values()
plt.bar(labels, vals)
plt.xticks(rotation=45)
plt.tight_layout()
plt.savefig(fname=loc + "/sphingolipid_barplot.png")
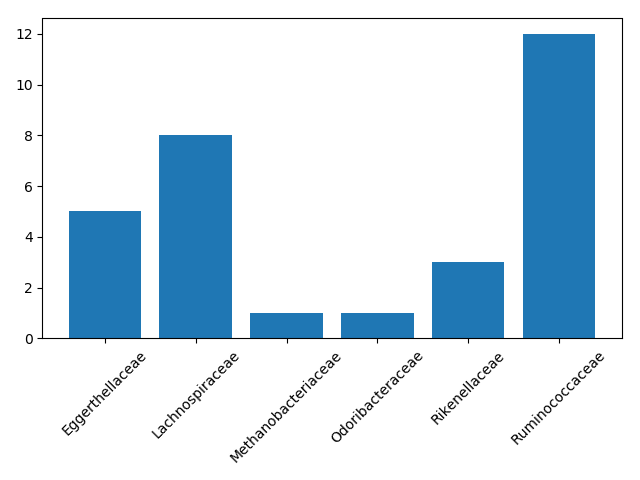
In this case, we were the most interested in the number of families with associations to sphingolipid clusters. However, we can also look at metabolic diversity in general. Which taxonomic families had the most diverse correlations, meaning they were connected to the largest number of metabolite classes?
query = 'MATCH p=(:Family)--(:Taxon)--(:Metabolite)--(:Chemical_class) RETURN p'
results = driver.query(query)
# Make an empty dictionary to store all chemical classes in
family_results = {x['p'][0]['name']: [] for x in results}
# For each matched pattern (one per metabolite cluster), add the chemical class
# Press enter twice to terminate the for loop if running from an interpreter
for result in results:
    family_results[result['p'][0]['name']].append(result['p'][6]['name'])
# Take the set of results so only unique chemical classes remain
family_results = {x: set(family_results[x]) for x in family_results}
# Count the number of chemical classes
count_results = {x: len(family_results[x]) for x in family_results}
print(count_results)

{'Ruminococcaceae': 215, 'Lachnospiraceae': 175, 'Eggerthellaceae': 151,
'Rikenellaceae': 145, 'Methanobacteriaceae': 74, 'Odoribacteraceae': 24,
'Eubacteriaceae': 71, 'Bacteroidaceae': 29, 'Erysipelotrichaceae': 49,
'Oscillospiraceae': 51, 'Sutterellaceae': 2, 'Coriobacteriaceae': 3,
'Veillonellaceae': 2, 'Clostridiaceae': 3, 'Desulfovibrionaceae': 4,
'Enterobacteriaceae': 1, 'Barnesiellaceae': 1}
It looks like Ruminococcaceae had the most associations to different chemical classes in this dataset, but increased relative abundance of other microbial families was also linked to hundreds of classes of chemicals.
In this case study, mako was used to add non-standard metabolite data to a Neo4j database. As demonstrated, we can upload any sort of additional data by formatting it appropriately, making it straightforward to include in our queries. Here, we only worked with a relatively simple dataset. However, for large meta-analytical approaches, microbe-metabolite networks like this could be used to investigate microbe-microbe networks in more detail.